In 2016, China's feed industry actively adapted to the "new normal", innovated development methods, increased structural adjustment, accelerated industrial integration and integration, optimized industrial strategic layout, strengthened product quality management, and further improved industry standardization and sustainable healthy development capabilities The industrial system has become more mature, and the industrial development has become more efficient. It has realized the transformation of China's feed industry from quantity to quality, and realized the feed industry.
First, the recoverable growth of the total output of commercial feed
As of December 31, 2016, there were 11,627 feed and feed additive manufacturing enterprises in the country, 7047 compound feed, concentrated feed and concentrate supplement manufacturing enterprises, 2396 additive premix feed manufacturing enterprises; 1947 feed additive manufacturing enterprises (Chemical synthesis, biological fermentation, extraction and other processes directly prepare 1099 feed additives, and 848 mixed feed additive manufacturers); 2167 single feed manufacturers. In 2016, the total output of national commercial feed was 209.18 million tons, a year-on-year increase of 4.5%. Among them, the output of compound feed was 180.95 million tons, an increase of 5.7% year-on-year; the output of concentrated feed was 18.32 million tons, a year-on-year decrease of 6.5%; the output of additive premix feed was 6.91 million tons, an increase of 5.8% year-on-year.
Second, continue to adjust the product structure
(1) The situation of different kinds of feed products. In 2016, pig feed output was 87.26 million tons, an increase of 4.6% year-on-year; egg and poultry feed output was 30.05 million tons, a year-on-year decrease of 0.5%; meat and poultry feed output was 60.11 million tons, an increase of 9.0%; aquatic feed output was 19.3 million tons , An increase of 1.9% year-on-year, the output of ruminant feed was 8.8 million tons, a decrease of 0.5%; the output of other feed was 3.66 million tons, an increase of 3.5%.
(2) Different types of feed products. In the compound feed, the total output of pig compound feed was 71.75 million tons, an increase of 5.5% year-on-year; egg and poultry compound feed was 25.36 million tons, an increase of 1.2% year-on-year; meat and poultry compound feed was 57.99 million tons, an increase of 9.9% year-on-year. Aquatic compound feed was 19.04 million tons, an increase of 2.1% year-on-year; concentrate supplements were 6.58 million tons, an increase of 0.3% year-on-year; other compound feed was 3.23 million tons, an increase of 10.1% year-on-year.
In concentrated feed, the total output of pig concentrated feed was 11.38 million tons, a year-on-year decrease of 3.0%; egg and poultry concentrated feed was 3.17 million tons, a year-on-year decrease of 13.0%; meat and poultry concentrated feed was 1.7 million tons, a year-on-year decrease of 9.4%; Tons, a year-on-year decrease of 45.5%; ruminant concentrated feed of 1.83 million tons, a year-on-year decrease of 6.0%; other concentrated feed of 220,000 tons, a year-on-year decrease of 40.3%.
In the additive premix feed, the total output of pig additive premix feed was 4.12 million tons, an increase of 11.9%; egg and poultry additive premix feed was 1.52 million tons, an increase of 0.8%; meat and poultry additive premix feed was 430,000 tons, a decrease of 19.2 %; Premix feed for aquatic additives was 240,000 tons, down 1.2% year-on-year; premix feed for ruminant additives was 390,000 tons, up 16.1% year-on-year; premix feed for other additives was 210,000 tons, down 11.9% year-on-year.
Third, the concentration of the feed industry continues to increase
In 2016, there were 9 provinces with a feed output of over 10 million tons, an increase from 2015, and the newly added region was Sichuan Province. The total output of feed in 9 provinces is 135.48 million tons, accounting for 64.8% of the national total output, an increase of 1.2 percentage points from 2015, Figure 1.
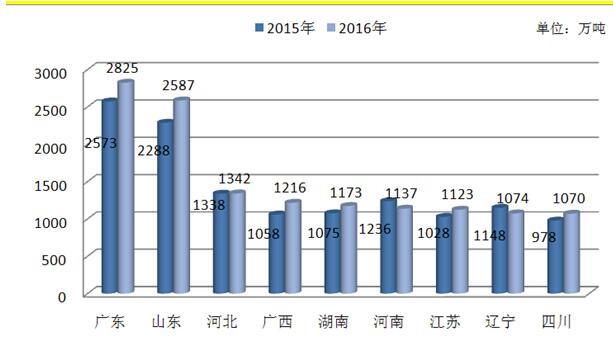
Feed output of 9 provinces from 2015 to 2016
4. Stable growth of output value and operating income of feed industry
In 2016, the total output value and total operating income of the national feed industry were 801.4 billion yuan and 777.8 billion yuan, an increase of 2.6% and 4.9% year-on-year. Among them, the total output value of the commercial feed industry was 729.4 billion yuan, an increase of 2.4% year-on-year; operating income was 709 billion yuan, an increase of 4.5% year-on-year; the total output value and operating income of feed machinery and equipment were 6.6 billion yuan, a year-on-year decrease of 3.8% respectively , 4.5%.
The total output value of feed additives was 65.4 billion yuan, a year-on-year increase of 6.2%. Among them, feed additives were 58.5 billion yuan, up 4.6% year-on-year; mixed feed additives were 6.9 billion yuan, down 3.2% year-on-year. The total operating income of feed additives was 62.3 billion yuan, a year-on-year increase of 10.6%. Among them, feed additives were 55.7 billion yuan, up 8.5% year-on-year; mixed feed additives were 6.6 billion yuan, up 4.2% year-on-year.
Fifth, the feed additive output increased by a large margin
In 2016, the total output of feed additive products was 9.759 million tons, a year-on-year increase of 19.5%. Among them, feed additives were 9.223 million tons, an increase of 20.7% year-on-year; mixed feed additives were 536,000 tons, an increase of 2.4% year-on-year.
Amino acids: The total output in 2016 was 2.018 million tons, a year-on-year increase of 30.6%. The amino acid in feed additives was 2.004 million tons, an increase of 31.7% year-on-year; the amino acid in mixed feed additives was 14,000 tons, a year-on-year decrease of 40.5%. Among the monomeric amino acids, lysine was 1.117 million tons (including 65% lysine), an increase of 16.7% year-on-year; methionine was 216,000 tons, an increase of 82.4% year-on-year; threonine was 526,000 tons, an increase of 38.7% year-on-year; 16,000 tons of amino acid, an increase of 56.7% year-on-year.
Vitamins: The total output in 2016 was 1.131 million tons, a year-on-year increase of 3.6%. Vitamins in feed additives were 959,000 tons, an increase of 4.5% year-on-year; vitamins in mixed feed additives were 173,000 tons, a decrease of 0.7% year-on-year. Among them, among the single vitamins, choline chloride was 622,000 tons, a year-on-year decrease of 2.3%; vitamin A was 9 million tons, a year-on-year decrease of 3.9%; vitamin E was 90 thousand tons, a year-on-year increase of 38.4%; vitamin B12 was 6 tons, a year-on-year increase of 37.9 %; Vitamin B2 6 794 tons, an increase of 1.5% year-on-year; Vitamin C 54,000 tons, a year-on-year decrease of 19.8%.
Mineral elements and their complexes: The total output in 2016 was 5.005 million tons, a year-on-year increase of 19.1%. The mineral elements and complexes in feed additives were 4.967 million tons, up 19.7% year-on-year; the mineral elements and complexes in mixed feed additives were 38,000 tons, down 28.8% year-on-year. Among them, among the single mineral elements and their complexes, copper sulfate was 18,000 tons, a year-on-year decrease of 36.5%; ferrous sulfate was 178,000 tons, a year-on-year increase of 22.4%; zinc sulfate was 146,000 tons, a year-on-year decrease of 5.1%; manganese sulfate 11.2 10,000 tons, an increase of 7.4% year-on-year; dicalcium phosphate (containing calcium dihydrogen phosphate) was 3.544 million tons, an increase of 8.6% year-on-year.
Enzyme preparations: The total output in 2016 was 116,000 tons, an increase of 18.2% year-on-year. The enzyme preparation in feed additives was 52,000 tons, an increase of 3.6% year-on-year; the enzyme preparation in mixed feed additives was 64,000 tons, an increase of 33.4% year-on-year.
Antioxidants: The total output in 2016 was 50,000 tons, a year-on-year decrease of 1.0%. The antioxidants in feed additives were 27,000 tons, down 1.1% year-on-year; the antioxidants in mixed feed additives were 23,000 tons, down 0.9% year-on-year.
Anti-corrosion and anti-fungal agent: The total output in 2016 was 157,000 tons, a year-on-year decrease of 38.3%. The preservatives and mold inhibitors in feed additives were 10 million tons, down 53.8% year-on-year; the preservatives and mold inhibitors in mixed feed additives were 57,000 tons, up 50.3% year-on-year.
Microorganisms: The total output in 2016 was 114,000 tons, a year-on-year increase of 4.9%. The microbes in feed additives were 65,000 tons, up 16.2% year-on-year; the microbes in mixed feed additives were 49,000 tons, down 6.9% year-on-year.
Other additives: The total output in 2016 was 1.168 million tons, a year-on-year increase of 43.5%. The other types of feed additives were 1.005 million tons, an increase of 49.3% year-on-year; the other types of mixed feed additives were 118,000 tons, an increase of 6.9% year-on-year.
VI. Total consumption of bulk feed raw materials increased
In 2016, the total consumption of some bulk raw materials was 191.49 million tons, a year-on-year increase of 7.0%. Among them, corn was 104.97 million tons, an increase of 21.5% year-on-year; wheat was 11.01 million tons, a year-on-year decrease of 22.0%; fish meal was 1.85 million tons, a year-on-year decrease of 39.3%; soybean meal was 37.8 million tons, a year-on-year decrease of 1.5%; cotton seed meal was 3.55 million tons , A year-on-year decrease of 18.3%; rapeseed meal 4.48 million tons, a year-on-year decrease of 5.0%; other cakes of 4.92 million tons, a year-on-year increase of 13.2%; calcium hydrogen phosphate, 2.44 million tons, a year-on-year decrease of 16.3%; other 20.47 million tons, a year-on-year decrease 1.0%.
Seven. The total production volume of large-scale feed machinery and equipment of complete sets increased
In 2016, the total production of feed processing machinery and equipment was 27,088 sets, a year-on-year decrease of 52 sets, a decrease of 0.2%. Among them, 1,359 sets of complete sets, an increase of 10 sets year-on-year, an increase of 0.7%; 25,729 sets of stand-alone units, a decrease of 62 units, a decrease of 0.2%.
In the complete set, 1,029 sets of equipment with an output of ≥10 tons per hour, an increase of 61 sets, an increase of 6.3%; 330 sets of equipment with an output of <10 tons per hour, a decrease of 51 sets, a decrease of 13.4%.
Among the stand-alone equipment, there are 8 319 crushers, an increase of 122 units or 1.5% year-on-year; 6 521 mixers, a decrease of 141 units year-on-year and a decrease of 2.1%; 6 178 granulators, a decrease of 1 498 units year-on-year and a decrease of 19.5 years %; 4,711 other stand-alone units, an increase of 1,455 units, an increase of 44.7%.
8. Exports of feed products and feed machinery increased or decreased
The export volume of feed products was 90,000 tons, up 3.0% year-on-year; the export volume of feed additives was 1.34 million tons, down 8.1% year-on-year; the export volume of single feed was 330,000 tons, down 40.4% year-on-year; the export volume of feed machinery was 10,000 units (sets), An increase of 0.1% year-on-year. The export volume of feed products and feed additives accounted for 0.04% and 13.7% of the total output respectively; feed machinery accounted for 36.9% of the total output.
The export value of feed products was 60,000 yuan, an increase of 36.5% year-on-year; the export value of feed additives was 1.23 million yuan, a year-on-year decrease of 3.0%; the export value of single feed was 90,000 yuan, a year-on-year decrease of 36.2%; %.
Nine, the number of employees fell, high-end talent growth
In 2016, the number of employees of feed enterprises at the end of the year was 476,000, a year-on-year decrease of 8.3%. The number of employees with college education or above is 188,000, accounting for 39.5% of the total number of employees. Among them, 1,892 doctors, an increase of 0.8% year-on-year; 9,150 masters, an increase of 4.1% year-on-year; 69,302 undergraduates, a year-on-year decrease of 6.8%; 107,343 college graduates, a decrease of 10.9% year-on-year; 288,436 others, A year-on-year decrease of 8.0%. There were 36,394 skilled workers, down 4.2% year-on-year. Among them, 22,003 laboratory technicians, down 4.0% year-on-year; 14,391 maintenance workers, down 4.6% year-on-year.
Note: The above statistical data comes from the statistical data of various provinces (autonomous regions and municipalities).